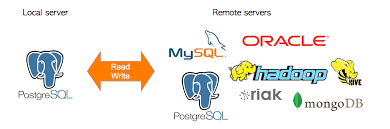
Have you ever felt the need to combined data from two databases or files in a simple way? PostgreSQL has a useful feature called Foreign Data Wrapper, which lets you create foreign tables in a PostgreSQL database that link other data sources. Queries happen near real time against a foreign table, the Foreign Data Wrapper will query the external data source and return the results as if they were coming from a table in your database.
After successfully implementing one such solution, I felt obliged to share these quick steps of how to set up postges mysql_fdw in Ubuntu.
What is a Foreign Data Wrapper(FDW)
The foreign data wrapper are libraries responsible for fetching data from the remote data source and returning it to the postgresql. FDWs allow you to connect to other data sources from within Postgres. From there you can query them with SQL, join across disparate data sets, or join across different systems.
Step 1: Download the postgres mysql_fdw extension from git hub
$ git clone https://github.com/enterprisedb/mysql_fdw.git -- DOWNLOAD mysql_fdw from git
Step 2: cd into the directory where the code was downloaded
$ cd mysql_fdw -- cd into the mysql_fdw folder
Step 3: Compile the code using make
$ make USE_PGXS=1
Step 4: Install the foreign data wrapper
Make USE_PGXS=1 install
Step 5: Log into postgres
Psql -U “username” -d “databasename” -p “port”
Step 6: Create the extension in postgres. CREATE EXTENSION loads a new extension into the current database
CREATE EXTENSION mysql_fdw;
Step 7: Define a new foreign-data wrapper. The foreign-data wrapper name must be unique within the database. CREATE SERVER defines a new foreign server.
CREATE SERVER mysql_server FOREIGN DATA WRAPPER mysql_fdw OPTIONS (host 'xx.xxx.xx.xxx’, port ‘xxxx’);
Step 8: CREATE USER MAPPINGdefines a mapping of a user to a foreign server. A user mapping typically encapsulates connection information that a foreign-data wrapper uses together with the information encapsulated by a foreign server to access an external data resource.
Step 9:
CREATE USER MAPPING FOR “postgres username”
SERVER “Give your foreign server a name”
OPTIONS (username 'type mysql username', password 'type mysql password’);
Most data innovation projects fail because organizations ignore basic steps that should drive the project. After doing several data science projects in the industry, I have learnt that the basics are as important as the science behind the innovation. The following steps will help any business initiate a successful data analytics project.
CONDUCT A DATA AUDIT
Having good data is a way of creating accountability in an organization. Accountable employees ensure due diligence in capturing and storing data generated from the day to day operations of the business. Most often, organizations find themselves in a fix where existing data is not usable. Poor data quality leads to wrong insight and ultimately wrong decisions.
With poor quality data, data projects are bound to be valueless
There is nothing so fatal than making wrong decisions due to wrong data. This in turn can affect a broad range of things ranging from the business focus, brand representation to product development.
Data audits should ultimately ensure all data required to make decisions is available in an analyzable formats.
To conduct a data audit:
Establish overall business or departmental objectives
Establish and gain access to all existing data sources
Establish departmental business processes
Retrace the business process in the data process
Evaluate data storage formats
Evaluate data to identify, Missing, Erratic, Redundant, Duplicates, poor design etc.
Takeaways from a data audit may necessitate either
Collection of more data
Restructuring of the database
Cleaning the existing database to make it analyzable
Data integration to combine data from disparate sources into meaningful and valuable information
DEVELOP DESCRIPTIVE ANALYSIS OF DATA (DATA VISUALIZATION)
Also referred to as summary statistics, descriptive statistics are used to describe the basic features of the data. They provide simple summaries about the data. Together with simple graphical analysis, they form the basis of virtually every quantitative analysis of data.
Descriptive analysis will help you construct a mental picture of your business henceforth making the right moves towards people and events.
Descriptive analysis uncovers interesting patterns in the database. Important arithmetic’s to consider while conducting descriptive analysis are measures of dispersion and measures of central tendency. Dispersion measures bring an interesting outlook in that rather than showing how data are similar, they show how data differs (its variation, spread, or dispersion). Most well-known measures of dispersion are range, variance, and standard deviation. From metrics such as variance change, formidable range and optimal deviation, indicators can be derived to sustain productivity.
Measures of central tendency on the other hand describe the central points in a data set which include mean, median and mode. The mode can be used to identify most frequent elements/customers/payments/time etc. Measures of central tendency are mostly important in identification of outliers. Outliers are extreme data values notably differing from other data points.
The output of this stage is a data visualization system which can answer the daily operational questions in a business. There are several commercial and open source tools that can be used to implement data visualizations. These are such as Tableau, PowerBI, JS libraries etc. To find out more on how to do this, reach out to Nakala Analytics.
IDENTIFY INDICATORS AND VARIABLES THAT MATTER TO YOUR BUSINESS.
Descriptive analytics generate a lot of insights. They deliver an overwhelming amount of information that can guide a business to understand patterns and insights. Much of the insights are fascinating but after running a data business for months, I have met people who would like to streamline their performance indicators.
Fancy and obvious indicators wanes over time because the information is not used to identify specific instances that may fasten objectiveness.
And why should it?! Having clearly understood historical performance from descriptive statistics, identification of conversion rates in a business processes, customer/user exit points, general trends and behavior can form a baseline of what needs to be measured to effectively monitor performance. Indicators also called KPIs will guide your business in rethinking whether you are meeting goals or not.
Well defined indicators can be tested. Simulation models can be used to prototype a physical model so as to predict its performance in the real world. Says Prof. Ddembe Willeese Williams
Simulation models will help you choose critical success factors. Critical success factors provides a list of activities that an entity should focus on to be successful. SMART success factors facilitate the meeting of business goals and objectives within set time frames.
The final stage of data understanding should result in variable identification. There are many variables yes!, but which ones are important? Several machine learning models exist that can help you bypass the curse of dimensionality.
COLLECT MORE DATA IF NECESSARY
In the statistical world, missing data is a common phenomenon which can be avoided. Even in a well-designed and controlled studies, missing data can reduce the statistical power of a study and can produce biased estimates, leading to invalid conclusions. While this is true in ad hoc research, businesses are dynamic as a result of both internal and external factors. That means, changes are bound to happen. Collecting more data happens to understand your market to offer more competitive and effective products and services.
Example of a question that may necessitate collection of more data: Does tribe matter when marketing household products to Kenyan communities?
DEVELOP & IMPROVE PREDICTIVE MODELS
The final and most valuable stage in executing a data analytics project is the modelling stage. The stage is completely dependent on having good indicators, quality data and well mapped success factors. Success factors in turn become variables. Predictive models assign a probability score to an outcome using a set of predictor variables.
At this point, data analytics / data science will make more sense to your organization.
Written by Enock Keya, Chief Data Analytics Consultant
In our data science community, an interesting hypothesis was raised. “Kenyan security forces should test the bodies of the DUSIT attackers for drug abuse. While the terrorist are radicalized back home, they pump themselves with drugs before missions to dull their senses and that's how they are able to walk through forests like Boni from Somalia, covering abnormal distances in a few days without needing to rest and having no remorse when they meet the victims.”
“Apparently, this may seem to be the pattern in codeine-high gangs of Eastleigh and Mombasa according” another contributor said.
According to the mirror "It is cited as being used by fighters and terrorists for highs before battle and to combat both physical and mental stress". The times once reported that the opioid drug can have stimulating effects and has been used by fighters to combat fatigue and fear.
“Italian police have seized 24 million tramadol tablets in a shipping container on its way from India to Libya, disrupting a trafficking operation believed to have been set up by the Islamic State with assistance from the Calabrian mafia” Times.
As data scientists, we are part of the society and our zeal to have a positive contribution drives us to participate in offering mathematical expertise to solving global challenges. This is should be our space..
Is it possible to get drug consumption and abuse data in Kenya/Africa/World? This data can help us to map out the entire supply chain, how these drugs move around to eventually help the government flush out potential hideouts way before a terrorist incident is reported. Investigating the supply chain might direct us to the sponsors and suppliers as well.
We can apply machine learning and algorithmic processes to map out potential hideouts. This solution would not only help identify regions with high abuse but can also be used to track misuse of drugs in government hospitals.
One of the main challenges towards realizing this solution is the unavailability of data. Do you know of anyone who can provide this data! We would love to explore and probably contribute my few cents!
If this sounds interesting, please get in touch and let’s collaborate! This email address is being protected from spambots. You need JavaScript enabled to view it.
The emergence of efficient technology solutions, has provided an opportunity for auditors to rethink the way traditional audits are executed. Big data organizations could in the next 10 years replace the services of traditional data auditors if they do not step up the fight.
The advent of big data offers a transformed audit experience which transcends sample based testing for business risks to investigative analysis of entire populations for any data relevant for an audit.
With technology innovation in data processing, and supercomputers, all data points are subject to scrutiny. This may include far-reaching millions and millions of transaction level activities used to uncover insights that might be difficult to uncover using traditional approaches.
Big data provides the correct tools and skills to conduct new generation audits. The use of machine learning also gives it an upper hand to detect fraud and other hidden business risks caused by the “little dirty secrets of data”.
While this is an emerging opportunity, it is necessary for data analytics practitioners to collaborate with incumbent auditors in a relationship which could offer investigative data skills data to the latter, while at the same time transitioning standard auditing practices to the big data experts.
To collaborate This email address is being protected from spambots. You need JavaScript enabled to view it.
Only use traditional (statistical) methods if you have sufficient data. Traditional models produce accurate forecasts with at least 3 years of successive clean data.
Consider hybrid methods of forecasting which incorporate traditional techniques as well as machine learning components to minimize chances of erratic predictions.
Consider a three step process before concluding on your finding.
Preprocess the data
Statistical forecasting
Standardize traditional forecasts using modern methods such as extreme learning machines.
Data pre-processing will lead to more effective results. The basic items to look at while preparing your data for forecast analysis are removing outliers, interpolating missing data and normalization.
Consider your industry. Some products and services have powerful features which vary depending on seasons. A good example is the fashion industry where color is a critical component. Some other factors that could alter your direction are:
What is the duration of product life cycle? Products with a short term lifecycle are easy to forecast.
Do your products vary that much? Do not combine entire sales forecasts if so?
Is the demand stable? Consider decomposing the time series and keenly evaluate each factor on its own.
Is it pre or post launch forecasting? Unavailability of data could render traditional techniques redundant. It might be an interesting look at user-generated content.
Are you using pre-order or post-order data.
Consider the predictive value of user-generated content. This can be obtained through social media and customer feedback. There is a need to look at a user as an active producer and not as a passive consumer.
Beware of the rapidly changing environment, i.e. the rise of web 2.0, Emergence of new technology and the availability of processing power