Customer segmentation

Customer segmentation

Customers are not the same. They live and behave differently and are at different stages in life. The basic concepts about people, such as age, gender, work, their likes and dislikes significantly influences what they do. He who understands what they do, rules over business. That is why it is important to understand your customer. One way to do this is by making use of big data analytics methods called segmentation analysis or clustering analysis. I will try to remain non-technical in order to disseminate as much information as possible to the business people.

What is customer segmentation?

Customer segmentation is the process of identifying how many distinct groups of customers exist in your database and what behavior do they exhibit that makes them different from each other. If you can do this on a piece of paper, you are a genius. Try out big data analytics

Who is likely to benefit the most?

Read full article


Customer Profiling ISSUE -2

Customer Profiling ISSUE -2

A client risk profile is the level of risk your business is willing to accept from the client while extending credit terms. Businesses manage risks by setting up credit policies which predetermine how much credit should be given and expected terms of payment.

Clients who are given a shorter payment period are deemed to be highly risky hence shorter or zero credit periods should be awarded. Offering credit often encourages customers to speed up or increase the amount of their spending. While that works, balancing the potential for increased sales with the risk of reduced cash flow is an important part of managing risk in your business. The nature of your business and size of transactions, are some factors that make businesses offer credit to new customers. Like any other transaction model, offering goods or services on credit has risks such as reduced cash flow, reduced profit margin and debts which could significantly affect your operations if the transaction size is huge. Before you decide whether to extend credit and if so, how much, there are several key factors you should consider.


Decide on how much risk your business is willing to accept. State your credit terms; how much credit are you willing to extend and how long you can
afford to wait for payment without jeopardizing your operations. What features characterize a customer to whom you are willing to extend credit? Develop a credit policy that covers the credit process starting from application submission to overdue collections.


Analyze the impact of credit to your overall business positioning. The modern market is dynamic characterized by speed and competition and while
spreadsheet methods that help in credit evaluation have worked before, it is important to start exploring alternative data driven ways of evaluating credit policies. Inherently, focus on methods that are efficient and require little efforts.


Businesses have been in a debate over the years on whether to consider
customer risk profiling as relevant when deciding on customer credit. It
is mostly with financial institutions that risk profiling has been taken
with full attention, this is influenced by the policies laid down. Over the
years, financial institutions have developed mechanisms to mitigate the
risk of lending to borrowers by performing a credit analysis. A decision is
arrived at after evaluating five key factors that predict the probability of
a borrower defaulting on his debt called the five Cs of credit which
include capital, capacity, conditions, character, and collateral. In spite of
the five Cs, most lenders place the greatest amount of weight on a
borrower's capacity.

What it takes to implement a good analytics solution

What it takes to implement a good analytics solution

Business analytics is the new acronym in effective business management. Most companies in the world if not already, wish to have a seamless way of accessing information to aid their daily performance management initiatives.

Information is not useful unless processed and relayed in a manner that is easily to understand. Companies are growing wings and as the organizational activities increases day by day, performance management becomes a core component of profitability. Data analytics basically refers to the process of collecting, organizing, analysing and presenting large sets of data to discover patterns and other useful information.

Data Analytics It’s not just about ad hoc analysis, neither is it end month reporting. It is about real-time performance management. There is no doubt that if we meet our individual targets every minute, we will achieve our business goals end month. An impressive repetitive trend if tapped can help the management direct more effort in that one activity. But we need to know where we are and how best we operate at any point in time.

"In this article we attempt to explore what it genuinely takes to implement a sound analytics solution."

Architectural Requirements

1) A well designed transactional database

This can either be structured or unstructured. Good database design is essential to ensure timely execution of an analytics project. With diversification of operational environments, data sources may vary: some may come from from social media, daily operational stats, while others are sourced from ecumenical APIs such as the local stock market

2) Data Warehousing

The main role of this feature is to do cumbersomely hefty processing after which data is then stored securely for front end visualization. A data organization platform has to be built to increase performance and reduce overhead when relaying authentic-time analytics. It is at this point that technologies such as data warehousing come in. A more modern approach requires the utilization of sizably voluminous data architectures such as Hadoop or Spanky. 

3) Data Visualization

Data visualization tools are front end software’s that aide in presentation of data in a pictorial format. They provide an easy to use functionality to create infographics, interactive data visualizations, and motion graphics. As a basic functionality they can connect to processed information lying in the middle tier in this architectural design. There are a variety of tools used to project information to the business. These range from low cost powerful tools such as Ms Excel which offer a similar functionality for organizations which do not have budgets to purchase propriety software’s. Other tools are such as Tableau, QlickView and other commercial software’s. Check out “Data visualization tools performance management analytics”. 

SPECIALIZATION

There is need to create a team of specialist’s to handle specific roles in this process. The onset of development begins with a good transactional database design which requires highly skilled database developers.

Second to that are business operations users who understand the business process. Understanding what the business is the first phase in realizing a useful analytic solution. This exercise requires in-depth skills of data engineers who are well versed with both business and database management skills. The role of data engineers is quite expansive as they are both involved in data collection, database query optimisation as well as data visualization activities. At the core of their role is to deliver a solution needed by the business. A data engineer should have core statistical and programming skills to play their role more expansively. Check out “Data engineers the next frontier in performance management initiatives”

To create effective data stories that enable business make correct decisions, there is need to understand the business objects. 99% of effective analytics solutions lies around comparing inputs and outputs. Business executives are resources who perform their daily tasks to achieve company targets. All an analytics solution does is transform the daily manual monitoring activities to tools that can be accessed anytime. Check out “Effective performance management analytics”

Lack of a sound analytics solution generates tension in a company. Every minute erroneous decisions are made based on personal intuition and experience. Frustrated managers eventually are not able to answer simple questions such as:

Yes you want to make the decision, that’s so brave of you, where is the proof.(Performance appraisal)?

  • Its two weeks down the line, where are we, we need to move? (Progressive analytics)?
  • How comes he got such a huge increment, get me his performance record history over the past one year (Evaluation)?
  • Can we monitor the activities real-time, we need to manage real-time? (Real Time Management)
  • Are we going to hit our targets this month (monitoring and evaluation?)
  • I need a set of charts to present my clients in tomorrow’s meeting, can I get that now? (Business presentation)

After a proper analytic solution implementation, correct and timely insights are realized.

  • Ahhhhhh…., now I know where to hit
  • What happened on 15TH, seems that’s where we lost it?
  • You are doing good, look at the trends
  • This graph doesn’t seem impressive, can we have a meeting?

While it might seem a simple task, they say leave it to the experts.

big data retail customer segmentation

big data retail customer segmentation


Developing a data driven business model

Developing a data driven business model

The value contained within data is universally recognized. As the seemingly relentless march of big data into so many aspects of the commercial and non-commercial world continues, the practicalities of constructing and implementing data-driven business models (ddbms) has become an ever-more important area of study and application.

Capitalizing on this data explosion is increasingly becoming a necessity in order for a business to remain competitive, and is a modern twist to the old adage, ‘knowledge is power’.

The challenges are threefold:

  1. How to extract data,
  2. How to refine it
  3. How to ensure it is utilized most effectively.

Punch lines

“businesses and other organizations that fail to align themselves with data driven practices risk losing a critical competitive advantage and, ultimately, market share and the accompanying revenue.”

“for today’s businesses, effective data utilization is concerned with not only competitiveness but also survival itself. Many businesses are developing new business models specifically designed to create additional business value by extracting, refining and ultimately capitalizing on data.”

“data-driven businesses have been demonstrated to have an output and productivity that is 5–6 percent higher than similar organizations who are not utilizing data-driven processes (josh b, et al, 2015 university of cambridge)”

Clearly there is value associated with effective big data utilization, and the race is on for existing businesses, both large and small, to capitalize upon it. However, although big-data-oriented publications agree on the potentially positive impact of big data utilization, very few suggest how, in practice, it can be attained and none offer a research-based guide or blueprint that can be utilized by an existing business to help create and implement its own data driven business models

The six questions of a data-enabled business

  1. What do we want to achieve by using big data?

In order for a business to effectively utilize big data it is vital that its aims are clear and realistically attainable.

  • Competitive advantages
  • Shortened supply chain
  • Expansion
  • Consolidation
  • Processing speed
  • Differentiation and brand
  1. What is our desired offering?

A business must decide in what way the model construct will benefit the company’s current offering or, alternatively, create an entirely new one

  1. What data do we require and how are we going to acquire it?

Data is obviously fundamental to a data driven business model. Deciding which data is most applicable, and the nature of that data’s acquisition, is pivotally important to the success of a ddbm construction. Established businesses with a substantial number of customers, and therefore potential customer interaction points, are well positioned to effectively utilize customer-provided data within their ddbm, although this data is often combined with data from other sources. Customer-provided and acquired data was utilized by 80 per cent of the business organizations analyzed, with self-generated and existing data utilization slightly lower at 75 per cent. Free available data was the least exploited, with 60 per cent of the business organizations analyzed using this data source. This high utilization of all available data sources by established organizations is indicative that these organizations understand the value of data and orient themselves towards becoming data-driven.

  1. In what ways are we going to process and apply this data?

Methods of processing reveal the true value contained within data. Knowing which key activities will be utilized to process data enables the business to plan accordingly, ensuring that the necessary hardware, software and employee skill sets are in place. To develop a complete picture of the key activities, the different activities were structured along the steps of the ‘virtual value chain’.¹² to gather data, a company can either generate the data itself internally or obtain the data from any external source (data acquisition). The generation can be done in various ways, either manually by internal staff, automatically through the use of sensors and tracking tools (e.g. Web-tracking scripts) or using crowd-sourcing tools. Insight is generated through analytics, which can be subdivided into: descriptive analytics, analytics activities that explain the past; predictive analytics, which predict/forecast future outcome; and prescriptive analytics, which predict future outcome and suggest decisions.

  1. How are we going to monetize it?

Without the target of a quantifiable benefit to a business it is difficult to justify ddbm construction and implementation. Incorporating a revenue model into a ddbm is integral to its operational success. Seven revenue streams are identified by hartmann et al (2014): asset sale, giving away the ownership rights of a good or service in exchange for money; lending/renting/leasing, temporarily granting someone the exclusive right to use an asset for a defined period of time; licensing, granting permission to use a protected intellectual property like a patent or copyright in exchange for a licensing fee; a usage fee is charged for the use of a particular service; a subscription fee is charged for the use of the service; a brokerage fee is charged for an intermediate service; or advertising. Revenue models associated with a ddbm differ considerably from a standard subscription fee such as the new york times for advertising. These models vary considerably between sectors and within industries.

  1. What are the barriers to us accomplishing our goal?

If an established business organization does not have sufficient data-oriented and experienced personnel within its business then a company culture that is not conducive to constructing and implementing a ddbm is likely to emerge. This may also lead to the development of a negative perception of ddbm construction and implementation within the business.

Conclusion

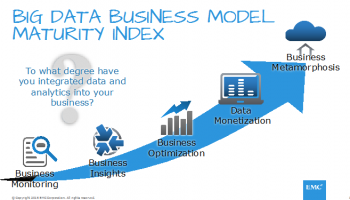
As the advantages of big data utilization become continually more profound, organizations are forced to incorporate innovative data-driven practices into their business strategy or risk losing competitiveness, market share and ultimately revenue. The ddbm-innovation blueprint enables organizations to construct their own ddbm that is unique to their business and environment. Data has now become invaluable to business, so much so for most businesses with aspirations of growth or long-term survival that it should no longer be a question of whether they should become data-driven but rather how and when.

 Adapted from cambridge working paper 2015 “data and analytics - data-driven business models: a blueprint for innovation” by josh brownlow, mohamed zaki, andy neely, and florian urmetzer

Edited and simplified by nakala analytics

About us : nakala analytics is a startup data analytics consultancy initiative headquartered in kenya, nairobi. We are a team of high tech professionals with vast experience in the industry implementing data analytics solutions. We help automate decisions models to match ever dynamic business models.

Visit our website: www.nakala-analytics.co.ke or email us: This email address is being protected from spambots. You need JavaScript enabled to view it. for more info