Non-invasive Blood Analysis using AI

Non-invasive Blood Analysis using AI

                                           detect low glucose levels


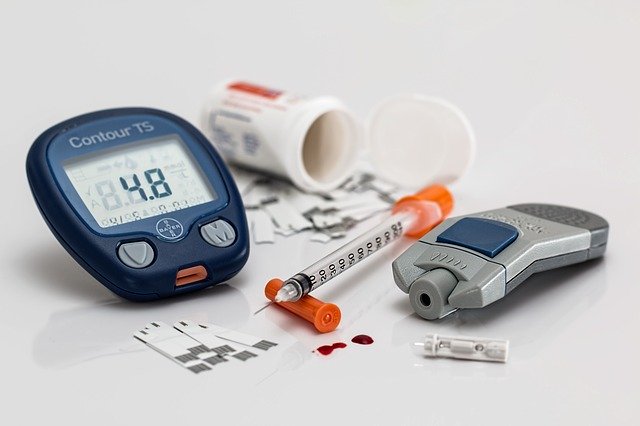
Blood analysis, also known as blood test, is the analysis of blood components. A healthcare provider may order blood analysis to help diagnose diseases such as diabetes, cancer, and viruses, to know whether body organs such as kidney, heart, and liver are working, to detect health problems in early stages, to track how well you are managing health conditions.

Normally when carrying out blood analysis, first your blood sample is collected, and then different tests are performed on the collected blood sample. But what if blood analysis could be done by just a simple scan of the skin? No need for blood collection.

Well, Bloods.ai is creating a technology that would enable just that, non-invasive blood analysis. This technology will use machine learning models to classify the level of specific chemical compounds in samples from their spectroscopic data. It is the fusion of spectroscopy, blood analysis, and artificial intelligence.

When a light beam passes through a sample, each compound in the sample absorbs or transmits light over a certain wavelength. Different compounds absorb best at different wavelengths. Thus, if you use a beam of light containing a range of wavelengths, you can measure the amount of energy absorbed for each wavelength. Such a measurement over different wavelengths (or frequencies) is called a spectrum (or spectral data). This technology will make use of spectral data from the Near Infra-Red (NIR) wavelengths. This is because NIR has the highest penetration power and goes deep into human tissues as compared to the other wavelengths.

Just like other mobile health technologies, this technology will extend the reach of healthcare beyond traditional clinical settings. A model will be incorporated into devices that will allow you to do your blood analysis in less than a minute, even at home. “We can make blood analysis to be a commodity much the same as measuring our weight,” says Oded Daniel, CEO, and co-founder of bloods.ai. “Weight is an indicator that tells a lot about our lifestyle, so imagine what is going to happen if we give people the ability to tap into those 2000 other compounds that are in our blood in the same level of ease as we weigh ourselves at home.”

Oded says that the whole project is in three stages. The first stage is the data collection stage, the second stage involves building machine learning models using the data collected and the last stage is the deployment stage. Currently, the second stage is in progress. The data scientists are working to build machine learning models and as of now, the best model has an accuracy of 0.9. For the first stage which is the data collection stage, a collection system was deployed where about 60 to 70 health institutes around the world send their bio-data. After which extensive datasets are created for data scientists to create models. The data collection is a continuous process and is still ongoing even now.

The final stage is planned to take place in two phases. The first phase will be to create a self-testing kiosk that contains the testing devices where you will be able to get your blood analysis done. These kiosks will be in public places such as stores, supermarkets, gyms, restaurants, and airports. Ideally, this technology is meant to create lifestyle awareness. So, apart from getting your blood analysis done, you will also get lifestyle recommendations based on the results from the blood analysis. For example, a kiosk machine which is located in a supermarket gives recommendations on what groceries you should buy based on your cholesterol levels measured by just a simple scan. The second phase will be to bring the blood analysis to the homes. This will involve making the application to be available on your personal devices such as phones and watches. Just like the self-testing kiosks, you will get your blood analysis done, only that this time you will be able to get it done from anywhere, even at home. 

According to Oded, this technology will not only be able to create lifestyle awareness but also be able to predict the early stages of diseases. In addition to giving recommendations on your lifestyle, it will also be able to indicate any possibility of a disease and if you need to visit a doctor and seek further consultation.

Inside the blood are many compounds, each and every one of them having a certain effect or influence on our health. This technology will be the first of its kind to tap into this vast knowledge, explains Oded.


Purity, Nakala Analytics

Data science crash course for business

Data science crash course for business

Overview

Leaders today manage organizations operating in highly complex, dynamic, and globally competitive business environments. In this age of data, the world is becoming more data-driven by the day. Scientific data analysis has become all-pervasive, making it one of the fastest-growing and most profoundly essential fields in management. Managers need to learn how to interpret their data to make decisive decisions. Operational data must maximize your impact while reducing the work required to achieve strategic objectives. The ability to use internal and external data is a skill that must help us to solve business problems and avoid the insanity of repeating the same action while expecting different results. Only organization leaders with a razor-sharp capability to consume and interpret data-rich environments and precisely translate that into strategic, operational decisions will successfully command future industry leadership and competitive dominance. Our world-class offering is designed for business professionals seeking to be agents of transformative change within their organizations.

Learning Outcomes.

At the end of this course, learners will gain the ability to:

  1. Learn the modern way to extract data from relational databases.  
  2. Learn modern ways to explore, prepare and assess the quality of the data using Python and present data using Tableau.
  3. Learn how to use basic to advanced analytics techniques for business forecasting, recommendation, and customer segmentation.
  4. Quickly and easily use actionable insights to improve decision making

Toolkit.

  • SQL, Tableau, Python/R, Postgres

Course Target Group.

Understanding how data science techniques can be applied influences successful strategic decision-making is crucial for every analyst in any modern-day organization. This training course is essential for professionals with an interest in data science and could be well suited for:

  1. Operations.
  2. Accountants. 
  3. HR.
  4. Management.
  5. All business professionals.

Course Schedule

Week 1: Data extraction & data inventory assessment using SQL.

Week 2: Exploratory data analysis using Tableau & Take-home project

Week 3: Introduction to data analytics models using Python & Take-home project

Week 4: Machine learning (Predictive, associative & segmentation models) & Capstone project 

Training Methodology

This training course will combine instructor-led presentations with interactive discussions between participating delegates and their interests. It is presented in a very hands-on way to suit individuals with varying levels of knowledge and experience. In addition, practical exercises, video material, and case studies will stimulate and support these discussions to maximize the participants. Above all, the course facilitators will extensively use case examples and case studies based on real-life strategic issues and situations in which he has been personally involved.

Follow up procedure

We follow up with the learners within one month after training to ensure the impacted skills are practiced.

Course Duration, Location & Investment


Duration:           4 Weeks (4 Hours per week).

Venue:               Remote (Evening Classes & Weekends).

Investment:       Ksh. 23,000 per head / Ksh. 40,000 for groups of 2


Registration

If you have any interest in this, please CLICK HERE to register to book your place with us, thanks!


 Big data will play key role post COVID19

Big data will play key role post COVID19

Data is the new science. Big data holds the answers. Pat Gelsinger.

According to DOMO's report “Over 2.5 quintillion bytes of data are created every single day.

And by 2020 it is estimated that 1.17MB of data will be created every second for a person on Earth”.In the 21st century, data is the new currency.

Photo by Negative Space from Pexels

Post COVID19 we will witness a new global order of data orientation which creates the significance of Big Data in the world.

So, let’s have a look what is big data all about? Big Data is a pool of large amount of data, which is structured or unstructured. With orientation and software techniques it can be managed efficiently for various useful purposes.

Big Data is characterized by Six V's-

In most of the countries of the world whether developed or developing has two broad great challenge in the upcoming post COVID19 world that is:

1) Vulnerability to health or health issues

2) Arising unemployment Does the big data has the answer for it? The answer is yes!

AETNA - Looks at patient results on a series of metabolic syndrome detecting tests assess patient risk factors and focus in treating one or two things that will have the most impact on improving their health. 90% of patients who didn’t have a previous visit with their doctor would benefit from screening and 60% would benefit from improving their adherence to their medicine regimen.

EVOVL- Helps large companies to make hiring and management decision through analytics. These two examples envisage how the post COVID19 world can be tackled efficiently. Now a question again arises, why only big data?

Firstly, the pandemic all over the world has tremored away the vibrant giant economies which needs immediate revival to normalcy.

Secondly, big data can play the role of game changer as being efficient and on time implementation of various projects by the government for example the accumulation of data who lost job in pandemic with skills to pursue so that they all can be arranged accordingly to work as per their skills.

Thirdly, it minimizes the leakages, misinformation and excludes human error.

Big data have scope in multidisciplinary fields such as security agencies aiding device, disaster management, economically calculating GDPs, financial data’s, environmental problems and many more.

Back to normalcy after COVID is challenging but with help of big data the world will be cognizable as a new efficient big data world.

Photo by fauxels from Pexels

Benefits of outsourcing your big data initiative

Market research report search engine predict market for data analytics, outsourcing to be valued at staggering $20 billion by 2026, and of CACGT of 29.4%. These reports mark the importance of outsourcing of data analytics in the upcoming few years! So, let us examine the benefit one could reap through outsourcing your big data initiative.

Outsourcing is a business practice in which service or job functions are framed out to third party. In Big data initiative it focuses on wide range of operations such as big data processing, analysis, storage and management. Companies may choose a service on shore (within same country), near shore (to other countries lies in same time zone) or offshore (to more distant country).

It is no longer a question of “IF” you should incorporate big data into your operations. What your business should be looking out for if “How to get started”.

Recruiting big data analytics team can slow down company’s development on many different levels. That means hiring top big data experts may force drastic budget cuts in other departments especially during these tough economic times. Cutting down your budget for key services will definitely have an effect on your company’s overall profitability and outsourcing big data tasks is definitely the best solution.

Reasons why you should outsource your big data initiative?

1. Win by all means

Consultants are specialized and dedicated to value delivery away from normal operational disruptions. With big data consultants, there is no chance for delay, you must win either way.

2. Room for innovation & operational disruption

Outsourcing of data makes way for innovative and creative ways to interpret data by special analytics.

3. Save cost and time

Save on cost of hiring, on-boarding, and training a new hire. It takes at least 6 months to get a good champ in data analytics. Their attrition rate is high

4. Quality of work

Consultants adopt best practices and follow through individual deliverables as per their mandate. You can be assured of a self-push to delivery.

5. Solves the problem of hiring wrong candidate

It is the responsibility of the consulting firm to seek for best skills while ensuring timely delivery.

6. Higher success ratio

Outsourcing provides higher success ratio than traditional methods of hiring.

To make it work, be certain of your needs. Clearly state the need for having a dedicated outsourced analytics team. The output/deliverables must be precise, clear and ones that truly inform your decision-making.

Why Outsource Your Analytics to Nakala!


Analytics efforts work when focused to specific product performance

Analytics efforts work when focused to specific product performance

Analytics Efforts are Only Beneficial if Tailored to Address Specific Product Performance

Technology, innovation and ever-changing trends have entirely changed the way businesses operate and how we have been looking at products. Be it marketing or product design and development, everything is customized these days.

Customers are looking for a more tailored and personalized approach to everything, be it how you sell them the product or how you design and develop the product itself.

Photo by Timur Saglambilek from Pexels

Data analytics has played a crucial role when it comes to designing and developing customer-centric products. But, how exactly do we use data analytics for addressing product performance?

It’s true that leveraging the power of data analytics to the maximum can enhance the proficiency of the products, improve advertising techniques, and support business growth. But, it’s also true that analytics efforts are only beneficial if tailored to address specific product performance.

You must be right in your approach here. Let’s see how this unfolds and what exactly do we mean.

The Role of Analytics

In the simplest of terms, analytics measure the state of the product. This can be anything how users are interacting with the product, what they are doing, where they are clicking and so on.

The purpose of analytics is to judge what is going on with the product, as measured by various metrics. And all of these insights when interpreted the right way, help with product improvement.

Analytics is the primary source of feedback you get on your product. Analytics is crucial to product management and product improvement. Without analytics, you won’t really know ever what’s going on with your product or if you are headed in the right direction or not.

The key results, insights and metrics brought to the forefront by analytics helps product teams make informed decisions about what’s not working out, what product functionality needs to be upgraded or what specific feature demands additional capabilities.

And, this is also the primary reason why your analytics efforts should always be focused on a specific part of the product performance, rather than taking everything into picture at once. Without analytics, product teams would never realise or understand if the revisions implemented have been able to solve customer’s problems or not.

What you don’t measure, you can’t improve.

And, if you measure as a whole, you can’t pinpoint where exactly the issue lies.

Directing Your Analytics Efforts in the Right Direction

What a lot of businesses do while implementing their analytics plans is to throw in a lot of seemingly complex and rich-in-insights analytics packages and track almost all sorts of data relevant to the product “as a whole”.

However, this approach seldom works!


Don’t do this!

This approach never helps because to begin with, you, as a product manager, didn’t know what you are looking for.

Not every feature of the product is data driven and not every feature plays the same role in making the product a success. Before implementing your analytics efforts, you should think about studying what analytics would help you reflect upon the performance of the product the fastest.

Going the other way round, you’d just end up with an overwhelming volume of data. You won’t have any vision about it and you would just feel drowned in this sea of data ending up latching onto the vanity metrics.

Thus, it’s super important that before you implement your analytics plan, you should be crystal clear about what parts of the product performance you need to track, and what exactly your end goal looks like, what data is relevant to you.


The key is to track relevant data points, not a whole lot of data!


Start with creating a plan that couples the data points you measure with the product vision you and your team had at the beginning of the development and design process along with the product’s key performance indicators (KPIs).

Pros of Working With Specific Data Points

Easy to Report

When studying the feedback for a product, you are expected to define if the improvements introduced have been a success or a failure.

And, for that to happen, you must understand the architecture of the product very well and see what metrics define the success or failure of what feature and what still needs to be worked on.

As against being drowned in a sea of data, tracking data relevant to achieving KPIs makes it easy to report and interpret.

If you don’t report the analytics you track, it’s a waste of time to track them anyway.

 Photo by Startup Stock Photos from Pexels

Common reporting methods such as trends and comparisons make sense only when you report them specifically for a functionality. It would be a great value addition if you are also capable of reporting them using visualization techniques.

For instance, if you are managing a social media platform, it makes more sense to individually track and report analytics on specific features such as the share option or the search option.

You should be focused on understanding what issues the audience is encountering with these data driven features of the product, rather than the product as a whole.

Helps Deliver Relevant Products

While you are focused on improving one feature at a time, you deliver better products with relevant features. Understanding customer insights and improving a particular part of the product helps decrease complexity.

Effective data collection and analysis helps companies stay competitive and on top of trends. Plus, leveraging predictive analytics helps get insights on what is expected from brands in the coming times and what pain points people are struggling with.

Thus, in addition to improving existing products, companies have an excellent opportunity to expand on new markets and develop new products. The optimization of the trial page of Volusion can be a good example of tailoring analytics efforts to a specific part of the product. To improve the lead generation rate, a new registration page was created and an A/B test was run against the then-current trial page.

The previous trial page was overloaded with information about the product and had a lot of CTAs and places to click around. Analyzing this, the newly designed trial page was modified and had some information about the trial (“No credit-card required” ) and removed all the possible distractions.

Thus, rather than modifying the entire product the lead conversion analytics were used to address the issue with the trail page alone. Further, when this didn’t work, the analytics efforts were narrowed down by segmenting the audience on the basis of location.

Informed Product Decision Making

Focusing on one feature at a time makes it easy to make informed decisions and wise choices.

Delivering relevant products also includes NOT overloading your product with irrelevant features. It is important to design the architecture of your product in such a way that it solves the problem of the user without feeling overcrowded.

And, this is possible only when you think about each of the features individually rather than focusing on the product as a whole. Analytics are vital for product design, development and improvement as they tell you what exactly is going on with your product and how your audience has been receiving it.

 Before you think you are all set to launch your product, you must understand and decide what needs to be tracked and reported. This forms the criteria for further choosing what data points out of all are relevant, how to measure it and how to use it for product improvement.